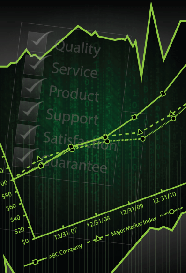
Performance Graph FAQs
What is the performance graph?
In Item 5 of the 10-K/Annual Report to Shareholders, a company must include a Total Return Graph showing the company’s stock performance, assuming reinvestment of dividends, for the past five fiscal years alongside a broad-based market index (such as the Dow Jones Total Market, S&P 500 or DJ Wilshire 5000). They must also include either a Published Industry Index or Peer Group of competitors selected in good faith, or of companies with similar market capitalization.
Dividend-reinvestment must also be incorporated for the Major Market and Industry Index or Peer Group for the entirety of the measurement period. This graph must be recalculated each year, which helps investors in assessing the company’s performance vis a vis overall markets and the company’s own industry in the given period.
What is Total Return Calculation for the Performance Graph? Is it the same as Stock-Tracking?
Total Return is not the same as stock-tracking. It is much more involved and much more difficult to calculate than simple closing price return.
Total Return Calculation includes the re-investment of dividends, historical split-adjustments, special calculations for spin-offs and special dividends, as well as market-capitalization and shares out-standing information. Imagine finding 5-years of historical, pricing, dividend and split data for 500 companies for the S&P 500 or 5000 for the Dow Jones Wilshire 5000 Index. Not an easy task. This is not an easy task, but with our specialized SEC compliant method of calculating, we are able to solve these calculations in order to create accurate Total Return Graphs.
What about financial websites offering Total Return in Real-Time?
Total Return cannot be calculated properly on “real-time” systems for the sake of a published graph. “Real-time” systems are riddled with errors due to the massive volume of trading that occurs and the vast number of companies reporting earnings information each day. Virtually every online site makes corrections for hours, sometimes days and weeks after trading is finished on any given day.
All accurate, licensed Total Return Data from S&P, Dow Jones, Dow Jones Wilshire, Russell, etc. is accompanied by a trademark and considered proprietary. Mutual Fund companies pay thousands of dollars a year to obtain this information for their quarterly reporting requirements. If you are not paying a licensing royalty, you should double-check your source of Total Return Data.
Virtually all Total Return Calculations are trademarked and take quite a bit of time to calculate for Published Indexes.
What constitutes a “Published Index”? (List of Published Indices)
A “published industry or line-of-business index” is one that is “accessible to the registrant’s security holders” and, if prepared by the registrant or an affiliate, is also “widely recognized and used.”
The Index must be maintained for Total Return with reinvested dividends on a regular basis, and the current components must be easily available to shareholders without subscription to a service.
Self-constructed indices (includes those prepared by a third party for the registrant and which are not “published”) are not prohibited or discouraged, but they must be weighted by market capitalization (as are most published indices) and include identification of the component issuers.
Does RDG Guarantee SEC Compliant Calculations?
Yes. RDG guarantees that all of its calculations are done in accordance with SEC methodology.
What if a company has not been trading for five years? Must they still file a Performance Graph?
Yes. If a company has been trading less than five years, they must plot a chart beginning with their first day of trading.
Companies that have a short fiscal year (for example, following an initial public offering as the result of a spin-off, or after emerging from bankruptcy) must do a stock performance graph for the short year unless the short year is 30 days or less.
Can we change our Major Market, Industry Index, or Peer Group? Is it difficult?
Not to worry, it’s not difficult at all. Companies do it all the time.
The SEC requires that both old and new Indexes/Peer Groups be shown for one “transition” year, after which the old Indexes/Peer Groups will be removed from the graph.
The company must explain the reason(s) for this change in the text accompanying the graph. This requires only a couple of sentences.*
Can we show different time periods than a five-year chart?
Yes, in addition to the five-year chart. However, the five-year performance graph must be included.
A registrant may show both a three-year graph and a five-year graph. Many companies include one-year or ten-year charts in addition to the five year to give their shareholders a picture of long and short-term performance.*